[[b;green;]A Brief Introduction to Prometheus on Kubernetes] --- [[b;yellow;]Author:] Arush Salil [[b;yellow;]Date:] March 27, 2019 --- A Brief Introduction to Prometheus on KubernetesPrometheus is an open-source systems monitoring and alerting toolkit originally built at SoundCloud. It is now a standalone open source project and is maintained independently of any company. To emphasize this, and to clarify the project’s governance structure, Prometheus joined the Cloud Native Computing Foundation in 2016 as the second hosted project, after Kubernetes.
A brief introduction to Prometheus
When working with Prometheus it is important to understand some of the differences, new features and new jargons that it brings to the table. In particular, we will be discussing the following:
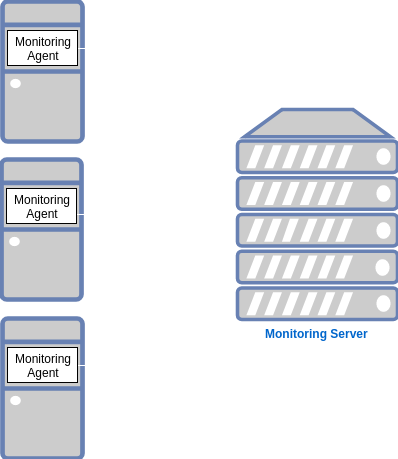
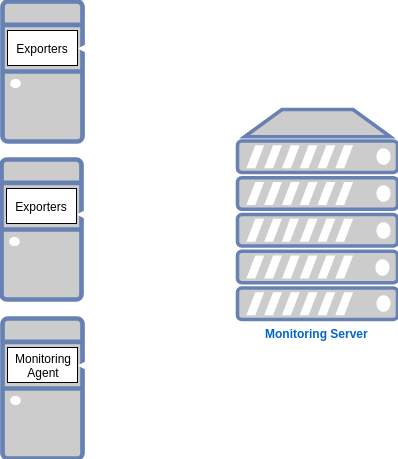
Unlike the traditional push methods where a monitoring agent would collect the metrics and will push to a centralized Monitoring server. Prometheus uses exporters that collect the system metrics and expose them at a defined endpoint from where the Prometheus server scrape or pulls the metrics.


The exporters are responsible for collecting and exposing Prometheus metrics for third-party or uninstrumented services. It resembles the monitoring agents in the traditional Push model.
Prometheus itself is only responsible for monitoring, and features such as alerting, visualization, data storage is managed by separate and independent components providing a totally modular design.
Prometheus evaluates the alerting rules as per the metrics data collected and send alerts to Alertmanager in case of a violation.
Alertmanager then accordingly group, and categorize them as per the defined rules, and send the alert notification to the different notification channels configured such as slack, hipchat, email, pager duty, etc.
A time series is a series of data points indexed (or listed or graphed) in time order. Most commonly, a time series is a sequence taken at successive equally spaced points in time.
- https://en.wikipedia.org/wiki/Time_series
We assume that you already have a running Kubernetes cluster. If not, go ahead and create one a small one now that you can use to follow along.
We will be using the Helm charts for Prometheus located at https://github.com/kubernetes/charts for this example.
Clone the repo: git clone https://github.com/kubernetes/charts
Modify stable/prometheus/values.yaml file as per your needs. A recommended production configuration would be to choose a high-performance storage class configured on your cluster for storageClass: and to have storage bigger than the 2Gi that is defined just above the storageClass under size:
Once done, deploy it using: helm install -f values.yaml stable/prometheus --name prometheus --namespace monitoring
This will apply the values.yamlfile to the stable Prometheus chart maintained by the Kubernetes project and will deploy it using Helm.
To let Prometheus scrape and monitor your services modify them to include:

Using above annotation Prometheus will autodiscover all of your services and will start monitoring them by scrapping the metrics.
Now edit stable/grafana/values.yaml and change the values of adminPassword, size, and storageClass to your liking.
Now, search for url and enter the Prometheus service endpoint.
Once done, install Grafana using: helm install -f values.yaml stable/grafana --name grafana --namespace monitoring
After the Grafana has been successfully deployed we will need to add Prometheus as a data source to Grafana. Steps for the same are listed below:
kubectl port-forward <name-of-grafana-pod> -n monitoring <local-port-number>:3000localhost:_<local-port-number>_ and enter your admin name and password.Create your first data source and fill in the required values as below:Name: A name to identify the data source
Type: Prometheus
URL: http://<prometheus-service-name>.monitoring.svc.cluster.local
Add.Your Prometheus setup should now be successfully added to Grafana. You can now browse and add various dashboards to see the metrics gathered from Prometheus. Some of the common pre-configured dashboards can be found at: https://grafana.com/dashboards.
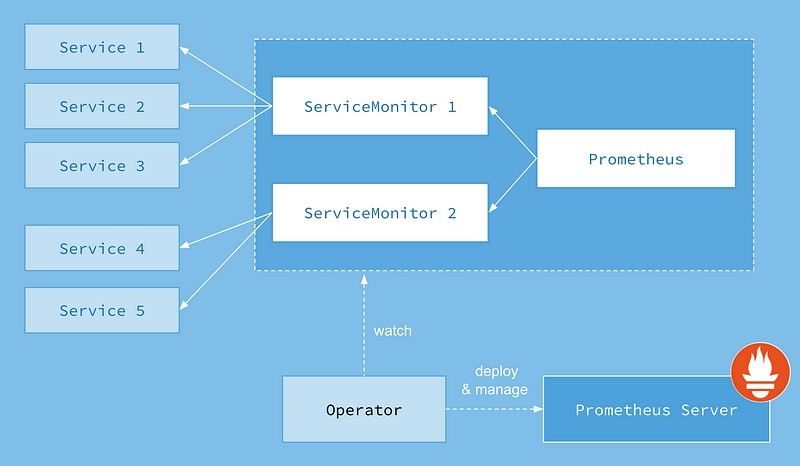
Apart from being deployed as a dedicated Kubernetes resource, Prometheus can also be deployed as a Kubernetes Operator. Using the Prometheus Operator we can natively and easily monitor the Kubernetes resources apart from managing Prometheus, Alertmanager and Grafana configuration.

Prometheus Operator uses a Custom Resource Definition (CRD), called ServiceMonitor, to manage the configuration. The ServiceMonitor will use the matchLabels selector to choose the resources to monitor and the Prometheus Operator will be using the label selectors to search for the resources after which it will create a Prometheus target so that Prometheus can scrape the resources for the metrics.
Steps to deploy Prometheus Operator:
helm repo add coreos https://s3-eu-west-1.amazonaws.com/coreos-charts/stable/helm install coreos/prometheus-operator --name prometheus-operator --namespace monitoringhelm install coreos/kube-prometheus --name prometheus-suite --namespace monitoringNow you can view Grafana and Prometheus using their services prometheus-suite-grafana and prometheus-suite respectively.